
Mobile game teams rely on App Store data and other store estimates for good reasons. They are fast, consistent, and often the only public way to compare titles. But the measurement boundary has become harder to ignore. Direct-to-consumer shops, advertising, subscriptions, regional Android stores, and cross-platform accounts can all create revenue that the App Store and Google Play do not report.
Store data can still be accurate about the store and wrong about the business. That matters when a team is sizing a genre, benchmarking a competitor, setting a launch target, or deciding that a mature title is fading.
GameMakers’ Q3 2026 mobile games report makes the limit unusually clear.1 Its 1,556-game dataset covers titles that earned at least $250,000 in one month of the quarter, but it excludes ads, direct web shops, China’s third-party Android stores, and games below that revenue threshold. Those are not minor footnotes. They define what the benchmark can and cannot say.
AC&A read: a store estimate is a channel estimate. Treat it as a company or market estimate only after checking what other revenue paths could change the answer.
A Store Decline Can Have Two Causes
GameMakers found worldwide store-IAP revenue down 6.9% year over year in Q3 2026 across its tracked universe. The United States drove 72% of that decline, with U.S. store revenue down 13.5% while the rest of the world remained slightly positive. On iOS, the U.S. decline reached 20.4%.1
One reading is straightforward: players spent less. Another is that some spending moved to channels the dataset does not observe. The report is careful not to pretend it can separate those causes. It also notes that downloads fell 8%, faster than store revenue, which points to real demand pressure beneath any DTC shift.
The right conclusion is not that store declines are fake. It is that one line can contain both demand loss and channel migration. Product leaders need to separate those two stories before they change a roadmap, cut a market, or copy a competitor’s monetization plan.
Playtika Shows How the Channel Mix Can Move
Playtika’s Q3 2026 results provide a clean public example.2 Total revenue was $673.8 million, almost flat against $674.6 million a year earlier. Yet the channels moved in opposite directions: DTC revenue rose 31.4% to $275.1 million, while third-party platform revenue fell 14.3% to $398.7 million.
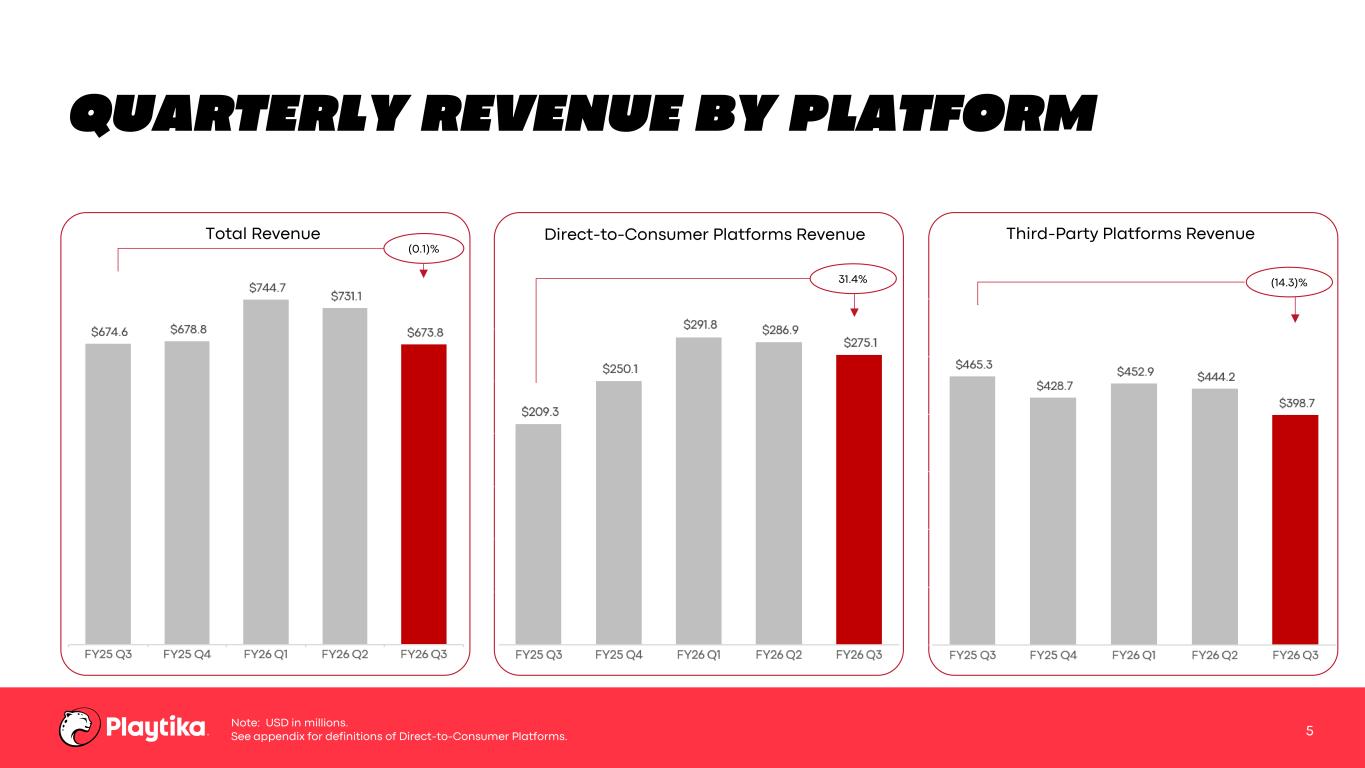
A store-only view would see the third-party decline and miss the offsetting direct revenue. It would not be wrong about Playtika’s app-store channel. It would be incomplete about Playtika.
This is also why DTC share should not be used as a universal score. Playtika reached 40.8% of total revenue through its own DTC platforms, but another portfolio may have a different payer mix, geography, platform exposure, or reason for keeping checkout in the app.2 The lesson is the size of the blind spot, not that every studio should copy the percentage.
IAP Is Not the Only Missing Revenue
Advertising creates a second gap. Sensor Tower’s H1 2026 Gaming Digital Market Index reported that gaming digital ad spend reached $7 billion, up 8%, while ad impressions reached 1.4 trillion, up 14%, even as mobile gaming IAP and downloads declined.3
That does not prove an individual ad-supported game is healthy. It does show why an IAP-only benchmark can understate a genre built around ads or a hybrid game that intentionally trades payer depth for scale. The same caution applies to regional Android stores and cross-platform products: the more varied the business model, the less one storefront can stand in for the whole thing.
A benchmark should match the game being benchmarked. A payer-heavy social casino title, an ads-first puzzle game, and a cross-platform RPG can all look similar in a download chart while producing revenue through very different paths.
Vendor Data Is Useful, but It Needs a Label
A PocketGamer.biz article sponsored by Xsolla says studios using more of Xsolla’s web-shop tools see about 25% of mobile spend move through the direct channel, compared with roughly 13% for studios using fewer tools.4 That is useful directional evidence, not a neutral market benchmark. It comes from a vendor’s client base and supports the vendor’s product argument.
The distinction matters. Vendor data can reveal mechanisms that public store charts miss, but the denominator, selection criteria, and commercial context should travel with the number. Good analysis does not discard interested sources; it states what interest they have.
The panel embedded below covers how studios are redefining player ownership. That wider relationship is why direct revenue deserves its own line in a benchmark, not just a note under store IAP.
What App Store Data Cannot See
App Store data remains valuable. It can show relative movement inside the observed channel, identify launch spikes, compare countries, and reveal when a title gains or loses store share. The mistake is quietly extending that answer beyond the data.
Before using an external estimate in a product or investment decision, label five things:
- Observed revenue: App Store IAP, Google Play IAP, ads, DTC, subscriptions, PC, console, or another channel.
- Missing revenue: which payment paths, regions, stores, and business models are outside the dataset.
- Matched comparison: whether the titles share a genre, payer model, geography, age, and platform mix.
- Corroborating signals: downloads, active users, payer conversion, ad load, company filings, or disclosed channel share.
- Confidence: what the team knows, what it infers, and what remains unknowable from public data.
The same logic applies to AC&A’s earlier argument that a web shop is not a revenue plan. Teams still need an offer, payment path, retention loop, and owner. But once those direct channels work, they also change how outsiders should read the business.
It also sharpens the point that more channels do not automatically create more control. More channels create more measurement work. If identity, finance, product analytics, and market intelligence use different revenue boundaries, the studio can misread its own performance as easily as it misreads a competitor.
The Decision Should Fit the Evidence
App Store data can support a store decision. It can help a UA lead judge visible category pressure or a product lead track relative momentum. It cannot, by itself, prove that a competitor’s total revenue fell, that players stopped spending, or that a genre is shrinking everywhere.
The distinction changes real decisions. A greenlight team comparing puzzle games should ask whether ad revenue is carrying the model. An investor reviewing a mature publisher should look for disclosed DTC share before treating a store decline as a company decline. A live-ops lead should separate purchases that moved to the web from players who stopped buying altogether. And a studio setting launch targets should not benchmark an app-store-only title against a cross-platform game without marking the missing channels.
Do not make a whole-business decision from a one-channel measurement. If the missing revenue could change the answer, say so and look for another signal. If no other signal exists, keep the uncertainty in the decision instead of replacing it with false precision.
For teams building a defensible market view, AC&A’s games consulting services can help connect market estimates, product data, economy design, and channel strategy before a benchmark hardens into a roadmap.