
When optimizing your app’s performance in the app store, it’s crucial to focus on metrics that drive real growth rather than those that simply look good on paper. Here’s the key takeaway: ASO KPIs (Key Performance Indicators) matter because they guide decisions, while vanity metrics are often just noise.
Key Metrics to Track:
- Install Conversion Rate: Measures how many users download your app after viewing it. Indicates how well your app store assets (like screenshots) perform.
- Keyword Rankings & Visibility Score: Tracks how discoverable your app is in search results. Helps optimize your ASO strategy.
- DAU/MAU Ratio: Shows user retention and engagement. A high ratio means users return frequently.
- Lifetime Value (LTV): Calculates the total profit a user generates over time. Aligns acquisition costs with revenue.
Vanity Metrics to Avoid:
- Total Downloads: Impressive but doesn’t reflect retention or engagement.
- Impressions: Tracks visibility but doesn’t guarantee installs.
- Cost per Install (CPI): Misleading if users don’t stick around or generate revenue.
Quick Tip:
Focus on actionable metrics like conversion rates, retention, and revenue per user. Vanity metrics may look impressive but don’t help you make better decisions or grow sustainably.
In short: Prioritize metrics that reveal user behavior and app performance. Avoid being distracted by numbers that don’t directly impact your bottom line.
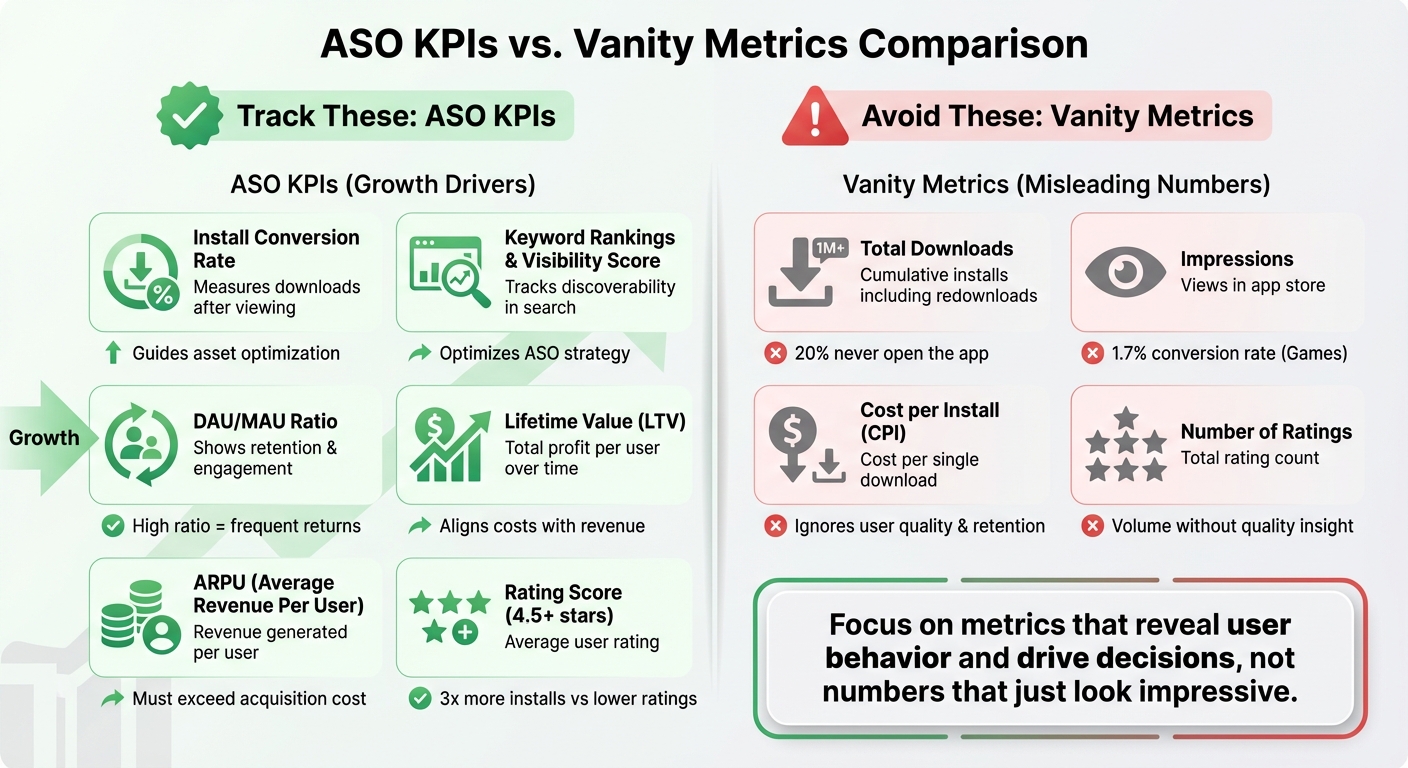
ASO KPIs vs Vanity Metrics: What to Track for App Growth
Visibility Metrics: What Matters vs. What Doesn’t
Keyword Rankings and Visibility Score
Keyword rankings show where your app lands in search results for specific terms. If your app ranks in the top 10 for high-traffic keywords, you’re in a prime spot to attract users with intent – people actively searching for what your app provides. This is critical because most users don’t scroll past the first few results [9].
Visibility Score, on the other hand, offers a broader perspective. It’s a metric scaled from 0 to 100 that combines the total keywords your app ranks for, the search volumes of those keywords, and your ranking positions [4][10]. Think of it as a health check for your app’s discoverability. While keyword rankings provide granular insights into specific terms, a Visibility Score helps you compare against competitors and track the overall effectiveness of your ASO (App Store Optimization) strategy over time [4][11].
Take this real-world example: In December 2022, the app Tiny Tower improved its rankings for keywords like "tower" and "towers." This strategic targeting resulted in a noticeable boost in downloads [11].
"ASO performance measurement relies on three observable areas: keyword visibility, store listing page conversion, and organic installs." – Valeria Rusu, App Growth Consultant, AppTweak [11]
When selecting keywords, don’t just chase high search volumes. Instead, focus on metrics like "Chance" or "Competitiveness" scores [10][13]. These provide a better sense of achievability. Monitor your keyword rankings weekly to stay ahead of algorithm changes or competitor moves [10]. And don’t overlook long-tail keywords – they often have less competition and attract users with specific intent [4].
Impressions as a Vanity Metric
Unlike keyword metrics, impressions are less reliable for measuring user intent.
Impressions track how often your app icon is viewed for more than a second in the App Store [12]. While this might sound helpful, impressions are often considered a vanity metric. Why? Because they don’t reveal whether those views translate into installs.
The data supports this: In 2022, the Games category had an average impressions-to-installs rate of just 1.7% [12]. That means 98.3% of impressions didn’t lead to downloads. For example, being featured on the App Store’s main page can skyrocket impressions, but conversion rates often drop since casual viewers are less likely to download [4].
"Impressions allow you to measure the visibility of your app, but they should not be the end goal of your ASO strategy as they do not necessarily lead to a download." – Justin Duckers, App Growth Consultant, AppTweak [12]
Here’s a quick comparison of these metrics:
| Metric | What it Measures | Business Impact | Tracking Tools |
|---|---|---|---|
| Keyword Rankings | Position for specific search terms | Brings in high-intent organic traffic | AppTweak, MobileAction, Appfigures |
| Visibility Score | Overall reach across keywords | Helps benchmark against competitors | AppRadar, MobileAction, AppTweak |
| Impressions | Total views in search/featured tabs | Tracks brand awareness/reach | App Store Connect |
Use impressions as a top-of-funnel metric [5][12]. If impressions are rising but downloads aren’t, it’s time to focus on conversion rate optimization. This could mean refining your app’s visuals or messaging [14]. Also, break down impressions by source (Search vs. Browse) to identify whether they’re coming from high-intent searchers or casual browsers [12].
sbb-itb-fd4a1f6
Conversion Metrics: Growth Drivers vs. Misleading Numbers
Install Conversion Rate and Product Page CTR
Install Conversion Rate (CR) tracks the percentage of users who download your app after viewing it in the store. It’s a key indicator of how well your app store assets – like screenshots and descriptions – are convincing users to hit "install" [1][11].
The formula differs slightly between platforms. On the App Store, CR is calculated as (Total Downloads / Unique Impressions) × 100, while Google Play uses (Acquisitions / Store Listing Visitors) × 100 [1][11]. Google Play often reports higher CRs because it only counts users who’ve already clicked through to your product page, meaning they’re more likely to install [11].
Product Page CTR (Click-Through Rate), on the other hand, measures how many impressions turn into product page views. A low CTR suggests that your app icon, title, or star rating isn’t grabbing attention in search results, signaling a need for improvement [4][16].
These two metrics are like breadcrumbs, showing exactly where users lose interest. For example:
- Low CTR? Your app icon, title, or ratings might not be compelling enough.
- Low CR but high CTR? Your screenshots or app description could be failing to close the deal [4].
"ASO specialists need to examine a broad set of metrics and prioritize them, to not lose focus and implement the right tactics. App success hinges on understanding your data." – AppRadar [1]
It’s also crucial to segment these metrics by traffic source. Search traffic tends to convert better than browse traffic because search users are already looking for a solution [1][4]. A/B testing your creatives is vital, with healthy conversion rates typically ranging between 20% and 40% [17].
Unlike total download numbers, these metrics offer actionable insights that directly guide your optimization efforts.
Total Downloads as a Vanity Metric
Total Downloads counts every installation, including redownloads [15]. While it’s easy to measure and looks great in presentations, it can be misleading.
This number keeps growing regardless of your app’s actual performance. For instance, 20% of users who download an app never even open it [1].
"The nice thing about us selling consoles is your console install base will always go up. But that’s not really a reflection of how healthy your ecosystem is." – Phil Spencer, Executive Vice President of Gaming, Microsoft [5]
Total downloads fail to account for critical factors like retention, user engagement, or acquisition costs [5][2]. Microsoft, for example, stopped reporting Xbox sales because cumulative numbers don’t reflect the true health of its ecosystem [5].
Here’s a quick breakdown of these metrics:
| Metric | Formula | Pros | Cons | Strategy |
|---|---|---|---|---|
| Install Conversion Rate | (Total Installs / Page Views) × 100 | Directly actionable; evaluates store asset performance | Can be skewed by low-quality traffic | Test and refine screenshots, descriptions, and videos |
| Product Page CTR | (Page Views / Impressions) × 100 | Highlights how well your app stands out in search | Doesn’t guarantee installs | Focus on improving app icon, title, and ratings |
| Total Downloads | Cumulative first-time + redownloads | Simple to track; good for social proof | Overlooks retention and user quality | Use as a baseline only; prioritize DAU/MAU metrics |
In short, focus on conversion rates instead of vanity metrics like total downloads. Conversion rates reveal whether your App Store Optimization (ASO) efforts are effective and point to specific areas for improvement. They’re also much better aligned with long-term user engagement and business goals [6][18].
Growth and Retention: Long-Term Metrics vs. Short-Term Numbers
DAU/MAU and Install Velocity
Daily Active Users (DAU) and Monthly Active Users (MAU) are key indicators of how engaged your audience is with your app. The ratio of these two metrics – (DAU / MAU) × 100 – is often referred to as "stickiness." This ratio highlights how often your monthly users return daily, offering a glimpse into whether your app has become part of their routine. A high stickiness score suggests strong user retention, which is essential for sustainable growth.
Install velocity, on the other hand, measures the speed at which users are downloading your app over a set period. This is particularly useful for assessing the immediate effects of marketing campaigns or App Store Optimization (ASO) updates. However, install velocity doesn’t reveal whether those downloads translate into long-term users. Think of it this way: install velocity shows how quickly the "bucket" is being filled, while DAU/MAU tells you how much is leaking out.
A notable example comes from Microsoft’s gaming division, which pivoted its focus in 2016 from Xbox console sales to Monthly Active Users for Xbox Live. Executive Vice President Phil Spencer explained:
"The nice thing about us selling consoles is your console install base will always go up. But that’s not really a reflection of how healthy your ecosystem is. We focus on the monthly active user base because we know those are [people] making a conscious choice to pick our content, our games, our platform, our service" [5].
While cumulative metrics like total downloads always trend upward, they can hide declining engagement. Install velocity might boost your app’s visibility in rankings, but it’s the active users – those who stick around and engage – that drive recurring revenue through ads, subscriptions, or in-app purchases. Without retention, high install velocity becomes an empty number.
Cost per Install as a Vanity Metric
Cost per Install (CPI) represents how much you spend to secure a single download. While it’s a common metric for evaluating marketing campaigns, it can be misleading when viewed in isolation. That’s because CPI doesn’t account for the quality of users or their potential to generate revenue.
A low CPI might look good on paper, but it’s meaningless if those users churn quickly or never contribute financially. As Lloyd Tabb, Founder and CTO of Looker, aptly stated:
"The number of people who download your product has no correlation with your company’s survival… How many apps go on viral spins and wither months – even weeks – later?" [2].
To assess the financial viability of your acquisition strategy, you need to compare CPI with Lifetime Value (LTV) – the total net profit a user generates over their entire relationship with your app. If your CPI is lower than your LTV, your acquisition strategy is on the right track. However, if CPI is high and users don’t stick around, you’re essentially throwing money away.
A more meaningful metric is Customer Acquisition Cost (CAC). Unlike CPI, CAC focuses on the cost of acquiring active, paying users rather than just downloads. For your business model to succeed, CAC must be significantly lower than LTV. Here’s how these metrics stack up:
| Metric | Definition | Relevance | Connection to Revenue Sustainability |
|---|---|---|---|
| Cost per Install (CPI) | Average marketing cost per app download | Evaluates campaign efficiency | Low; doesn’t reflect user engagement or revenue |
| Customer Acquisition Cost (CAC) | Total spend divided by active, paying users acquired | Measures cost of growing revenue-generating users | High; directly tied to profitability |
| Lifetime Value (LTV) | Net profit a user generates over their lifecycle | Determines acquisition spending limits | Critical; if LTV doesn’t exceed CAC, the model fails |
| DAU/MAU Ratio | Ratio of daily to monthly active users | Reflects user retention and product fit | High; retained users drive recurring revenue |
Instead of focusing solely on shallow metrics like CPI, prioritize unit economics that tie acquisition costs to retention and revenue. For example, monitor how paid campaigns impact organic uplift – the ratio of organic installs to paid installs – and ensure your efforts are driving both short-term and long-term success [3][19]. Next, we’ll dive into how user feedback and monetization strategies can further refine your ASO efforts.
User Feedback and Monetization: High-Impact Metrics vs. Shallow Data
Rating Score, ARPU, and LTV
Your app’s average rating score isn’t just a vanity number – it plays a direct role in how platforms like Apple and Google rank apps in their search results [20][3]. Apps with ratings above 4.5 stars tend to get 3x more installs compared to lower-rated competitors [20]. Why? High ratings act as a trust signal, reassuring potential users of your app’s quality.
But here’s the catch: recent ratings matter more than historical ones. Both app stores prioritize fresh feedback, so if your app struggled at launch but has improved since, those newer 5-star reviews will outweigh older complaints [3][4]. This makes maintaining ongoing user satisfaction critical.
Metrics like ARPU (Average Revenue Per User) and LTV (Lifetime Value) are equally important for assessing your app’s financial health. ARPU measures how much revenue you generate per user, while LTV estimates the total profit a user brings over their lifetime. To stay profitable, your ARPU must always exceed your Customer Acquisition Cost (CAC) [3][4]. For instance, if you spend $5 to acquire a user but only make $3 back, you’re setting yourself up for losses.
LTV also helps you identify traffic sources that bring in high-value users – those who stick around and spend more [3][4][1]. High retention rates, which boost LTV, can indirectly improve your app’s ranking. Why? App store algorithms see strong retention as a sign that your app is relevant and engaging [20][4].
A real-world example: In 2023, Standard Bank faced a flood of negative reviews about slow transfers. Using AppFollow, they implemented AI-based auto-replies and tagged "transfer delay" issues for their engineering team. This allowed them to respond to 80% of reviews within seconds, leading to a +646% increase in positive user feedback while holding a 4.4-star average [21].
Now, let’s explore why chasing sheer numbers of ratings can lead you astray.
Number of Ratings as a Vanity Metric
The total number of ratings might look impressive at first glance, but it can be misleading if you don’t dig deeper. For example, a high volume of 1-star ratings can tank your rankings, no matter how many ratings you have overall [20][3]. Users care more about high scores and detailed reviews than the sheer quantity of feedback [4][3].
Instead of focusing on the total count, pay attention to metrics like the ratio of ratings to reviews or the frequency of new ratings. These indicators can reveal whether recent updates are resonating with users [8][4]. In industries like fintech, keeping your average rating between 4.0 and 4.3 is often the minimum standard – falling below that can significantly hurt your product page’s conversion rate [21].
| Metric | Quality Level | Influence on Algorithm | Improvement Strategy |
|---|---|---|---|
| Average Rating Score | High (Growth Driver) | Strong: Directly affects search and category rankings [20][3]. | Use in-app prompts and address negative feedback quickly [20]. |
| Lifetime Value (LTV) | High (Strategic) | Indirect: High LTV signals strong retention [20][4]. | Enhance onboarding and release regular feature updates [20]. |
| ARPU | High (Strategic) | Low: Primarily impacts business sustainability [3][4]. | refine app monetization funnels and target high-value keywords [3]. |
| Number of Ratings | Low (Vanity) | Moderate: Volume alone lacks insight without sentiment analysis [3]. | Focus on generating recent ratings rather than total volume [3]. |
Tracking incremental ratings – like averages over the past 7, 30, or 90 days – can act as an early-warning system. This helps you spot potential issues, such as bugs or declining user sentiment, before they spiral out of control [21]. Additionally, monitoring deleted reviews can offer insight into extreme user frustrations that might otherwise go unnoticed [21].
How To Monitor Your ASO Efforts – Which Metrics To Track and How To Interpret Results
Key Takeaways: Focus on Metrics That Drive Results
When it comes to app store optimization (ASO), understanding the distinction between actionable KPIs and vanity metrics is critical. The key question to ask yourself is this: Does this number guide a specific business decision? Vanity metrics, while often impressive at first glance, fail this test because they don’t inspire action or reflect genuine user value [6][7]. On the other hand, actionable KPIs – like install conversion rate, DAU/MAU ratio, ARPU, and LTV – offer a clear picture of whether your ASO strategy is bringing in the right users, not just more users [5][18].
One common pitfall is relying too heavily on cumulative numbers. These figures naturally trend upward, even when engagement or retention is slipping [6]. Instead, prioritize ratios and rates, which remain steady unless there’s a meaningful shift in your app’s user experience [8].
For freemium mobile games, this focus becomes even more important. Every metric ties directly to monetization, so it’s not just about how many players you acquire – it’s about whether they stick around and spend enough to cover your acquisition costs. This is where expert guidance can make a difference. We at Adrian Crook & Associates, with over 17 years of experience and a track record of working with 300+ clients, specialize in helping freemium game developers navigate these complexities. Our tailored ASO and KPI consulting can help you move beyond shallow data to the kind of deep analysis that drives long-term growth.
To make your metrics truly actionable, apply the accountability test: determine who is responsible for each metric and what actions will follow when the numbers change [6]. If no one’s job hinges on the performance of a metric, it’s likely a vanity metric [7]. Pair these key KPIs with retention-focused strategies to ensure you’re not just attracting users but keeping them engaged for the long haul [6][7].
FAQs
Which ASO metrics should I prioritize first?
When evaluating your app’s success, keep an eye on metrics that highlight its visibility, like impressions and store listing visitors. These numbers reveal how easily potential users can discover your app. On top of that, pay close attention to conversion rate metrics, especially the install conversion rate, which shows how well you’re turning visitors into actual users. Together, these key performance indicators (KPIs) offer valuable insights into your app’s growth and overall performance in the competitive app marketplace.
How can I tell if a metric is a vanity metric for my app?
Metrics can become "vanity metrics" when they fail to drive meaningful business results or enhance your app’s performance. Think about numbers like social media followers or total downloads – without proper context, they don’t tell the full story. Instead, prioritize actionable KPIs that directly influence growth and user engagement.
How do I connect ASO changes to revenue (LTV vs. CAC)?
To connect App Store Optimization (ASO) efforts to revenue, focus on key performance indicators (KPIs) that influence lifetime value (LTV) and customer acquisition cost (CAC). Metrics like conversion rates, organic installs, and user reviews are essential for evaluating how ASO impacts visibility and user engagement. For instance, achieving higher keyword rankings can enhance LTV, while optimizing store page conversions can reduce CAC – both of which directly contribute to revenue growth.